History and Insights
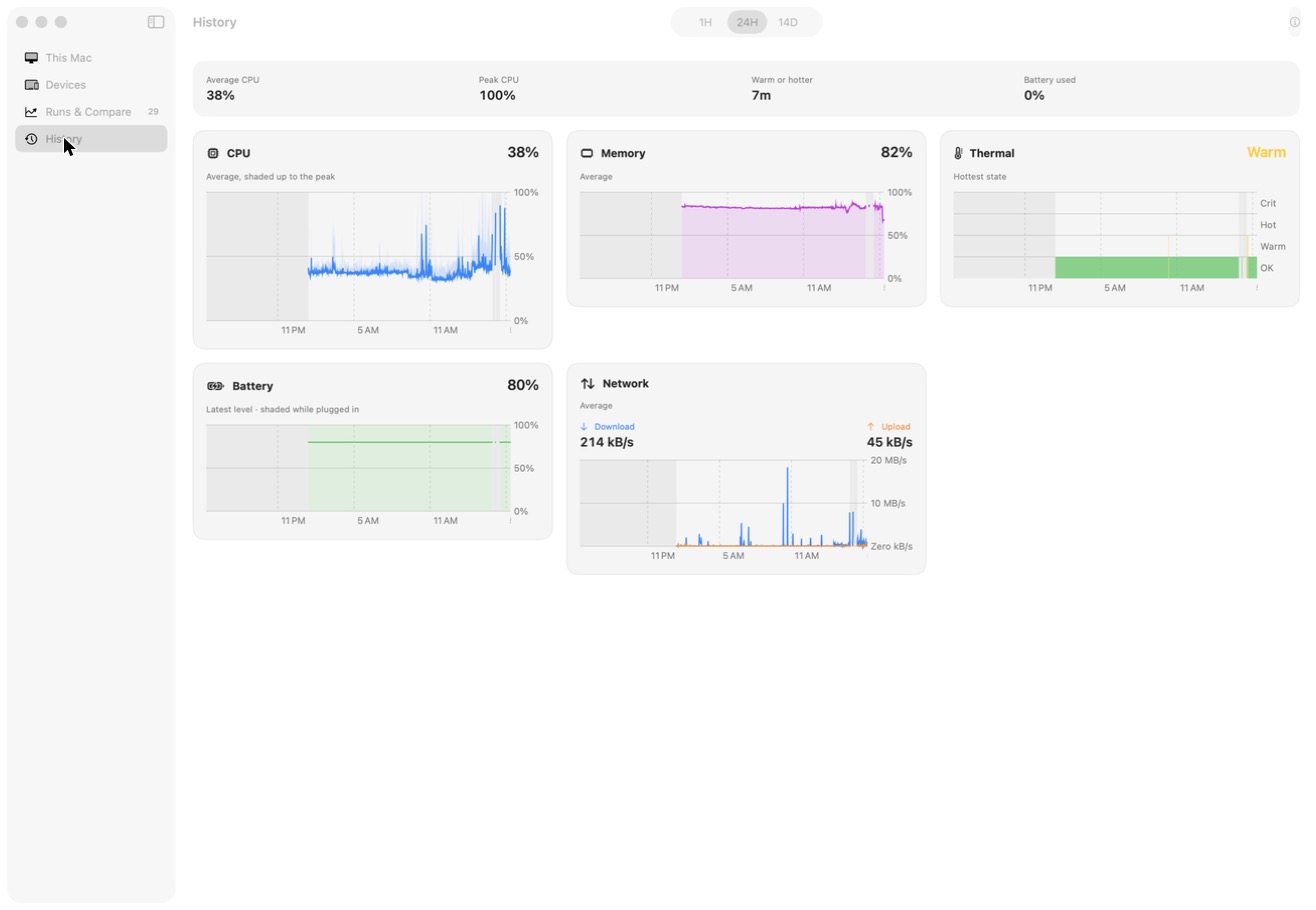
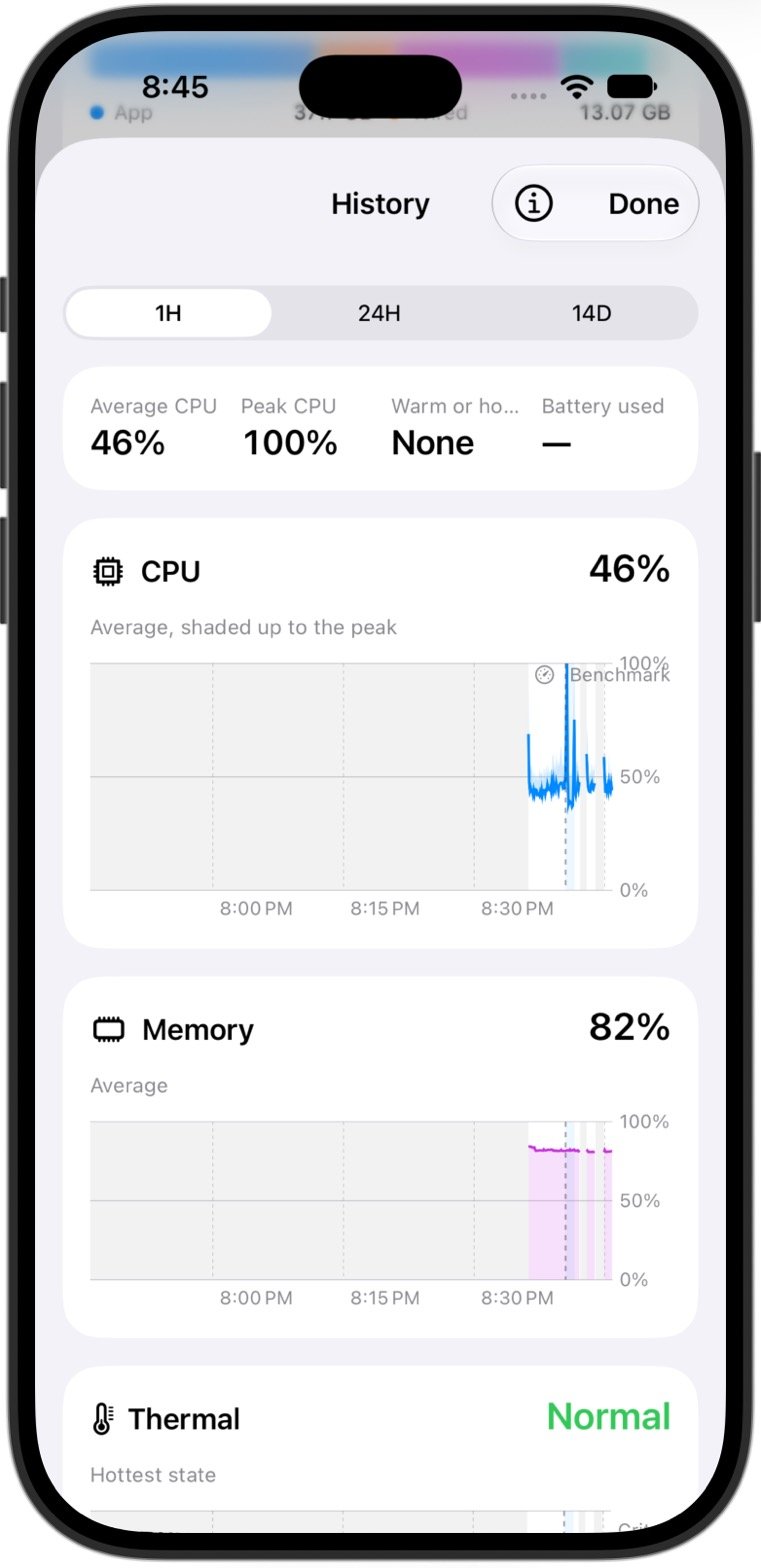
Therbie keeps a record of your device's CPU, memory, thermal state, battery and network on the device itself, and draws it as charts. The Insights card turns that record into short findings, such as "Ran warm 3 times today". To open the charts, go to the Device tab and tap Show History on the History card.
How much is kept
| Range | One reading per | Covers |
|---|---|---|
| 1H | 5 seconds | The last hour |
| 24H | 1 minute | The last 24 hours |
| 14D | 15 minutes | The last 14 days |
Older readings are deleted from the device after 14 days. A paired Mac keeps its copy longer; see Therbie for Mac.
Each longer range keeps the average CPU, the peak CPU, the average memory, the hottest thermal state, the last battery level and the average network speed.
When Therbie records
Therbie can only record while it's running:
- while Therbie is on screen;
- while the floating monitor is open;
- each time a widget or the Control Center control refreshes;
- each time a Shortcuts action runs;
- every 10 seconds while a sensor keeps Therbie running in the background, for example during a trip.
Time with no readings is shaded on the charts. Gaps are normal and are never filled in.
Tip Keep a Therbie widget on a Home Screen page you visit often. Each widget refresh adds a reading, which fills in more of the day.
Benchmarks, throttle tests and floating-monitor sessions appear on the charts as marked periods, so you can see why the device was hot at a given time.
If a sensor is on, its own chart appears in History too, for example Vibration, Sound Level or Barometer. See the sensor pages, such as Motion instruments.
Insights
The Insights card shows the most notable finding from Today. Tap Show All to see every finding for Today (midnight to now) and This Week (the last 7 days, including today). Findings can cover:
- how much of the period Therbie saw, so a quiet chart isn't mistaken for a quiet device;
- time spent Warm or hotter, or that the device stayed cool;
- the busiest hours of the day;
- average CPU and memory use;
- charging that was slower than usual, or normal;
- how much cellular data you've used this billing cycle;
- findings from sensors that are on, such as steps, a falling barometer, or the loudest moment.
Insights only state what the readings show. When there isn't enough data, the card says so.
On the Mac
Therbie for Mac keeps the same History for the Mac itself. It also shows the History it receives from your paired iPhones and iPads. See Therbie for Mac.